
If We’re Growing, Why Aren’t We Better Off?
In economics, the topic of efficiency and productivity has long fascinated economists. Whether dealing with large or small countries, size is irrelevant; what matters is how efficiently they utilize their resources. Naturally, one might assume that Gross Domestic Product (GDP) growth stems from a greater accumulation of factors such as capital (having more allows one to produce more) or labor (more people); however, there is a third element: doing more with the same.
The concept of Total Factor Productivity (TFP) was formally introduced by Robert Solow in his seminal 1957 article, “Technical Change and the Aggregate Production Function.” Solow sought to explain what proportion of economic growth could be attributed to the accumulation of capital and labor, versus what proportion stemmed from other sources.
Formal Definition:
In the framework of an aggregate production function:
Y = A × F(K, L)
Where:
- Y = aggregate output
- K = capital stock
- L = labor input
- A = Total Factor Productivity (TFP)
Specifically for the Cobb-Douglas function:
Y = A × K^α × L^(1-α)
Taking logarithms and differentiating with respect to time:
ΔY/Y = ΔA/A + α(ΔK/K) + (1-α)(ΔL/L)
Where ΔA/A is the TFP growth, calculated as the residual:
ΔA/A = ΔY/Y — α(ΔK/K) — (1-α)(ΔL/L)
In-depth Economic Interpretation:
TFP represents everything that increases output without increasing measured inputs. Hulten (2001), in his exhaustive review for the NBER (National Bureau of Economic Research), identifies at least seven distinct components captured by TFP:
- Pure technological change: New inventions, scientific discoveries, product and process innovations.
- Technical efficiency: How close an economy is to its production frontier. Economies that waste resources have low technical efficiency.
- Allocative efficiency: How well resources are allocated among different uses. Distortions (monopolies, excessive regulations, protectionism) reduce allocative efficiency.
- Economies of scale: When market size allows for more efficient production.
- Changes in output composition: Movement toward higher value-added products.
- Unmeasured changes in input quality: Better worker education, better capital quality.
- Measurement effects: Errors in measuring output, capital, or labor.
The Problem of the Residual:
Moses Abramovitz (1956) famously called the Solow residual “a measure of our ignorance.” TFP is not a single, clear concept, but rather an amalgam of everything we haven’t explicitly measured. This is simultaneously its strength (it captures effects that are difficult to measure) and its weakness (we don’t know exactly what we are measuring).
What was I trying to understand?
Guatemala (my country) is a resilient economy. In the last 30 years, it has only experienced a recession once, during the COVID-19 pandemic. Its average economic growth is 3.5%, with minimal variability. Its stability is enviable; however, to achieve an increase in mean income, it must grow more. If we want to double our income, using the Rule of 70, it would take us around 20 years (70/3.5) — too long for a developing economy. I need to accelerate growth to achieve doubling in 10 years, which means growing at around 7%.
With this questioning in mind, I began to look at what other countries have done, principally those that have experienced massive economic growth starting from complicated conditions: Japan (after WWII), China (before the 80s), and the United States (since its inception). Comparing what they did or which areas they focused on to shed light on how I can achieve this with growth.
It was there that the concept of “what we do not know” made sense to me. I decided, then, to use the TFP methodology to make my comparisons. I started with Guatemala.
Guatemala’s TFP
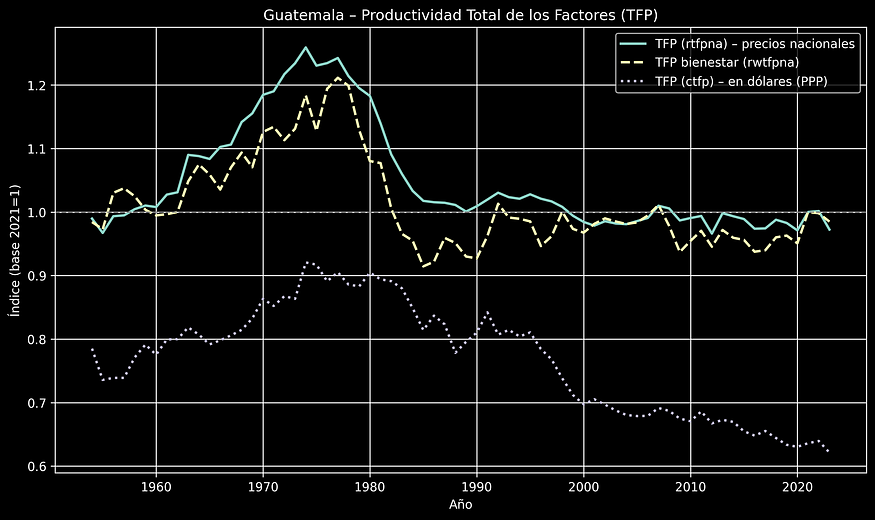
In the case of Guatemala, when analyzing how total TFP has evolved from 1960 to date, the graph reveals interesting points. The early years show a sharp rise, as the country entered a stage of Import Substitution Industrialization (ISI), driven mainly by ECLAC (Economic Commission for Latin America and the Caribbean).
Subsequently, in the 1970s, with the creation of the Central American Common Market, this momentum continued, albeit at a slower pace. During the most critical years of the 80s, the country suffered a considerable decline. Factors such as the internal armed conflict — more so than the debt crisis affecting most countries — caused the country to experience a major recession. It is worth noting that the country never defaulted on its debt.
During the economic recovery from the 90s to date, specifically starting in 1996, there is no trend in TFP; that is, the economy grows solely through the accumulation of capital and labor. We grow because we accumulate more. This is problematic: if the country wants to grow in the short term beyond its historical average of 3.5% and its low variability, it must invest more (accumulating first), but there must be a profound internal transformation so that the productivity effect occurs simultaneously.
This is a conundrum for the economy: we are growing, okay, but how do we do it faster? That is the essential question we have to answer.
Another important aspect presented in the graph is the divergence the country shows when using productivity with Purchasing Power Parity (PPP) dollars, in which the country has had a downward trend from the 60s to the present; that is, comparatively, we are drifting further away from the United States (this being the benchmark country against which the world is compared). This makes our need to improve productivity an even steeper challenge. An important aspect is that, at the moment, there are no official labor or capital productivity statistics generated by the Central Bank.
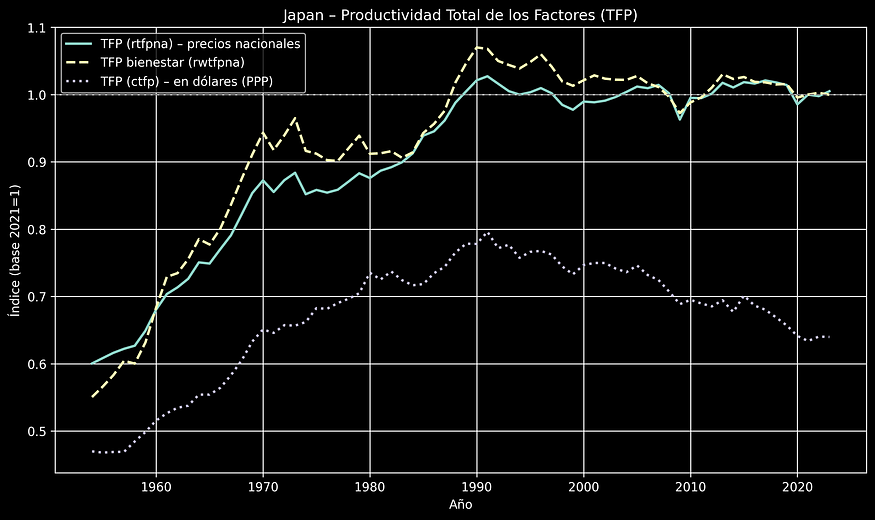
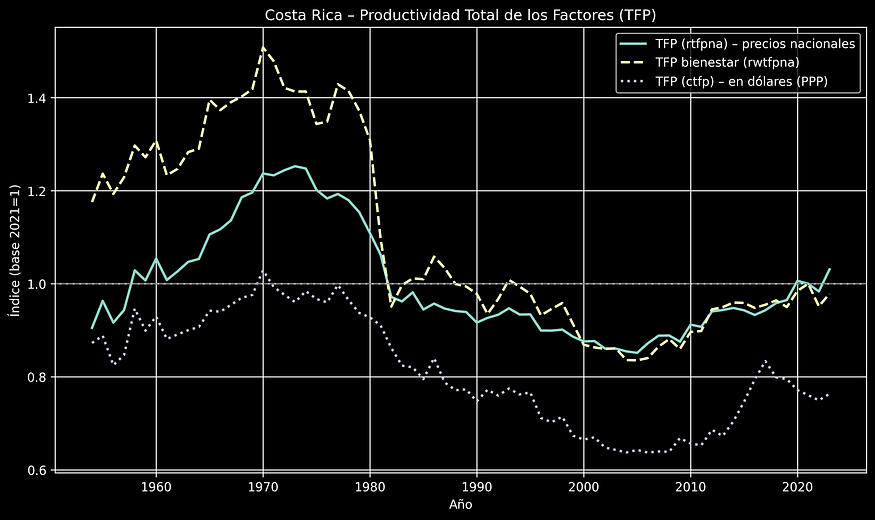
The graph has the following legend:
- TFP (rtfpna) at national prices: Consists of total factor productivity at national prices, base 2021=1.
- Welfare TFP (rwtfpna): TFP relevant to welfare, at constant national prices (2021=1). This attempts to measure consumer welfare, not production.
- TFP (ctfp) — in PPP dollars — : An indicator based on PPP (international prices allowing for comparison) and with USA=1; it is designed to measure how far a country is from the frontier (USA) in aggregate productivity. Caution is advised, as two factors can affect this here: changes in prices and productivity.
Evolution of Guatemala’s TFP from 1954 to 2023
Source: Prepared by the author based on data from the Penn World Table.
Now, strictly for comparative purposes, we will include the United States, China, Japan, and Costa Rica (the most developed country in Central America) to visualize their trends.
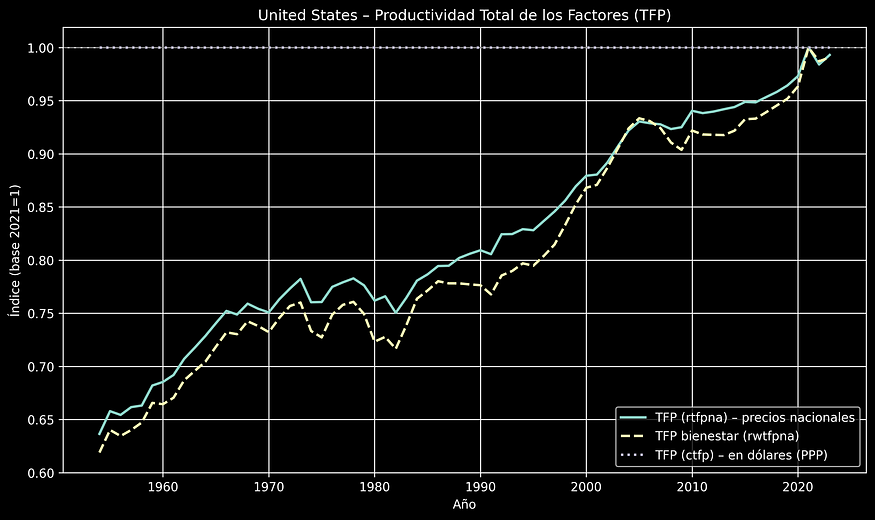
Evolution of US TFP from 1954 to 2023
Source: Prepared by the author based on data from the Penn World Table.
Since the United States is the country against which all comparisons are made, the TFP (ctfp) — in PPP dollars — is a dotted line at 1. This explains why it starts below 1 beginning in 1954. The crucial point is that it is an upward curve; that is, its productivity is consistently increasing, with the exception of the 1980s when it experienced inflation and stagnation. It is an economy that always seeks productivity in addition to accumulation. That is the key.
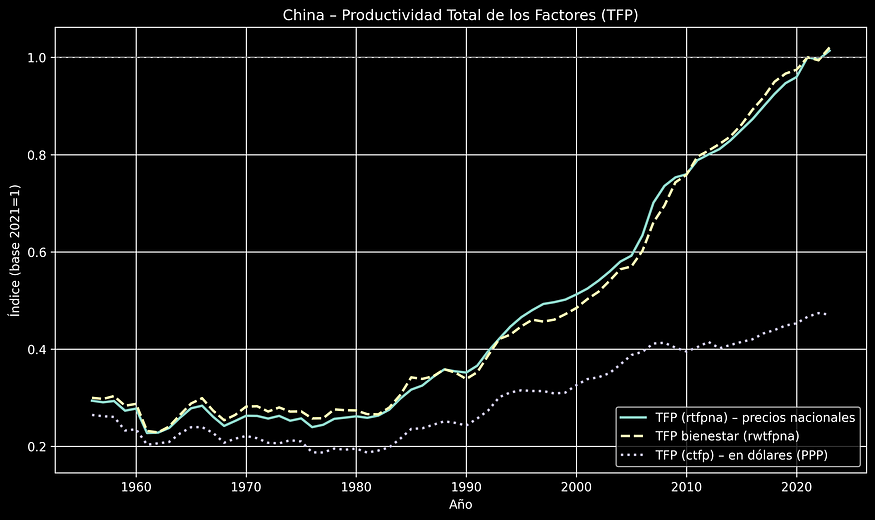
Evolution of China’s TFP from 1954 to 2023
Source: Prepared by the author based on data from the Penn World Table.
It has an aggressively positive slope, showing a catch-up effect with the United States (although it is still between 45% — 50% of real efficiency compared to that country). However, it is a machine of internal efficiency; TFP (rtfpna) at national prices — which compares the country against itself — continues to grow.
Evolution of Japan’s TFP from 1954 to 2023
Source: Prepared by the author based on data from the Penn World Table.
Japan shows what past success looks like. We see the aggressive catch-up between 1960 and 1990 (the ctfp line rises from 0.5 to 0.8). However, after 1990 (the bursting of its bubble), Japan enters a secular stagnation similar in form to Guatemala’s, but with much higher wealth levels. It teaches us that TFP has a natural limit when reaching the technological frontier and as the population ages. It is also complicated, as wealth also has a limit, and capital injection or migrant flows could help recover the economy through accumulation.
Evolution of Costa Rica’s TFP from 1954 to 2023
Source: Prepared by the author based on data from the Penn World Table.
The comparative analysis of Total Factor Productivity (TFP) demonstrates that, following the shared collapse of the 1980s, Guatemala and Costa Rica have followed divergent trajectories, yet both face a common problem of non-convergence toward the global technological frontier.
The graphs show that while Costa Rica managed to stabilize its efficiency at a higher level following its economic opening, Guatemala has maintained a stagnant productivity curve since 1990, relying almost exclusively on labor accumulation rather than technical improvements. The downward trend in the Purchasing Power Parity (PPP) adjusted series confirms that Guatemala, despite internal stability and growth, has lost relative ground against global efficiency, operating with processes that have not undergone structural modernization in three decades.
However, when integrating capital stock data, the perspective on acceleration potential shifts drastically in favor of Guatemala. The accumulation graph reveals that Costa Rica has already multiplied its initial capital by nearly 43 times, entering a phase of diminishing returns where each additional point of growth requires increasingly costly and complex investments.
In contrast, Guatemala has barely expanded its capital 20-fold, indicating that it operates far below its theoretical capacity. This grants it a mathematical “convergence” advantage: starting from such a low capital base, a cycle of sustained investment would generate a much more aggressive and rapid impact on growth acceleration than what its neighbor could achieve, given Costa Rica’s more limited margin for expansion.
Methodology:
A. Data Source: Penn World Table https://www.rug.nl/ggdc/productivity/pwt/?lang=en
B. Columns used:
Year: yearrtfpna: TFP at constant national prices (2021=1)rwtfpna: Welfare-relevant TFP at constant national prices (2021=1)ctfp: TFP level at current PPPs (USA=1)
Translation note: This translation was made by Google Gemini (assisted). The Spanish version of the article is the authoritative one and prevails in case of any discrepancies.
Need specialized consulting in economics, trade or business contacts? Contact us: [email protected]