And this is just the beginning — the same method applies to any product.
Rotterdam is Europe’s largest port. Millions of containers pass through it every year. But there is something its customs system does not record: transit. A container that enters and leaves toward Germany without passing through Dutch customs simply does not exist in its ledgers.
For years, those of us working in trade intelligence knew this was happening. We saw it in conversations with buyers, in volumes that didn’t add up, in final destinations that never appeared in the data. But we had no way to calculate it.
Now we do.
The Idea Is Simple. The Data, Revealing.
There are two major international trade sources. BACI from France’s CEPII collects what exporters declare. TradeMap from the ITC collects what importers declare. In theory they should tell the same story. In practice, the difference between them is exactly the size of the secret.
Take bananas — the world’s most traded fresh fruit — as a case study. In 2023, Ecuador declared having exported $284.5 million to the Netherlands. The Netherlands declared having imported $229.7 million from Ecuador. There are $73.8 million that left Guayaquil, entered Rotterdam, and disappeared from Dutch records.
They didn’t disappear from the world. They were redistributed across Europe. Rotterdam simply didn’t count them as its own.
How We Calculated It
The first challenge is technical: BACI reports in FOB — the price at the origin port — and TradeMap in CIF, which includes the ship freight. To compare, everything needs to be on the same basis.
For Ecuador, maritime freight to Europe is approximately 9% of the value:
$229.7M ÷ 1.09 = $210.7M in FOB
Now the difference with BACI is clean: $284.5M − $210.7M = $73.8 million redistributed in 2023.
But there is a second equally revealing phenomenon. The Netherlands also declared having bought $86.4 million from Germany. Germany does not produce bananas. What actually happens is that Latin American bananas pass through German operators before arriving in Rotterdam — and Dutch customs records it as if it came from Germany.
For this case the adjustment has three layers — because that banana traveled three stages before the Netherlands recorded it as «bought from Germany»:
| Layer | Concept | Factor |
|---|---|---|
| 1 | Maritime freight Latin America → European port | 9% |
| 2 | German logistics operator margin | 2.5% |
| 3 | Truck freight Germany → Rotterdam | 2% |
| Total | (1.09) × (1.025) × (1.02) | = 1.1396 |
$86.4M ÷ 1.1396 = $75.8M in real origin value
Now the comparison is direct. The Netherlands declared having bought $75.8 million of banana from Germany. Germany, for its part, only declared having sold $31.7 million to the Netherlands. There are $44.1 million that the Netherlands says it bought from Germany but that Germany does not declare having sold. That banana exists — someone bought it, someone sold it — but its real origin is unknown. It could be Ecuadorian, Colombian, Costa Rican. That is part of the secret Rotterdam still keeps.
The full computation for both countries in 2023:
| Ecuador | Germany | |
|---|---|---|
| BACI — what it declared exporting to NL | $284.5M | $31.7M |
| TradeMap CIF — what NL declared buying | $229.7M | $86.4M |
| Adjustment proxy | ÷ 1.09 | ÷ 1.1396 |
| TradeMap FOB real origin | $210.7M | $75.8M |
| Difference (BACI − TM FOB) | +$73.8M | −$44.1M |
| What it means | Ecuadorian banana redistributed by Rotterdam | Latin American banana bought via Germany, origin unknown |
Eight Years of the Same Pattern
2023 is not an anomaly. Between 2017 and 2024, the pattern repeats every year:
| Year | Banana redistributed by Rotterdam | Banana NL bought from Europe |
|---|---|---|
| 2017 | $162M | $20M |
| 2018 | $195M | $111M |
| 2019 | $207M | $90M |
| 2020 | $189M | $126M |
| 2021 | $131M | $103M |
| 2022 | $175M | $55M |
| 2023 | $115M | $105M |
| 2024 | $145M | $82M |
| Total | $1,317M | $691M |
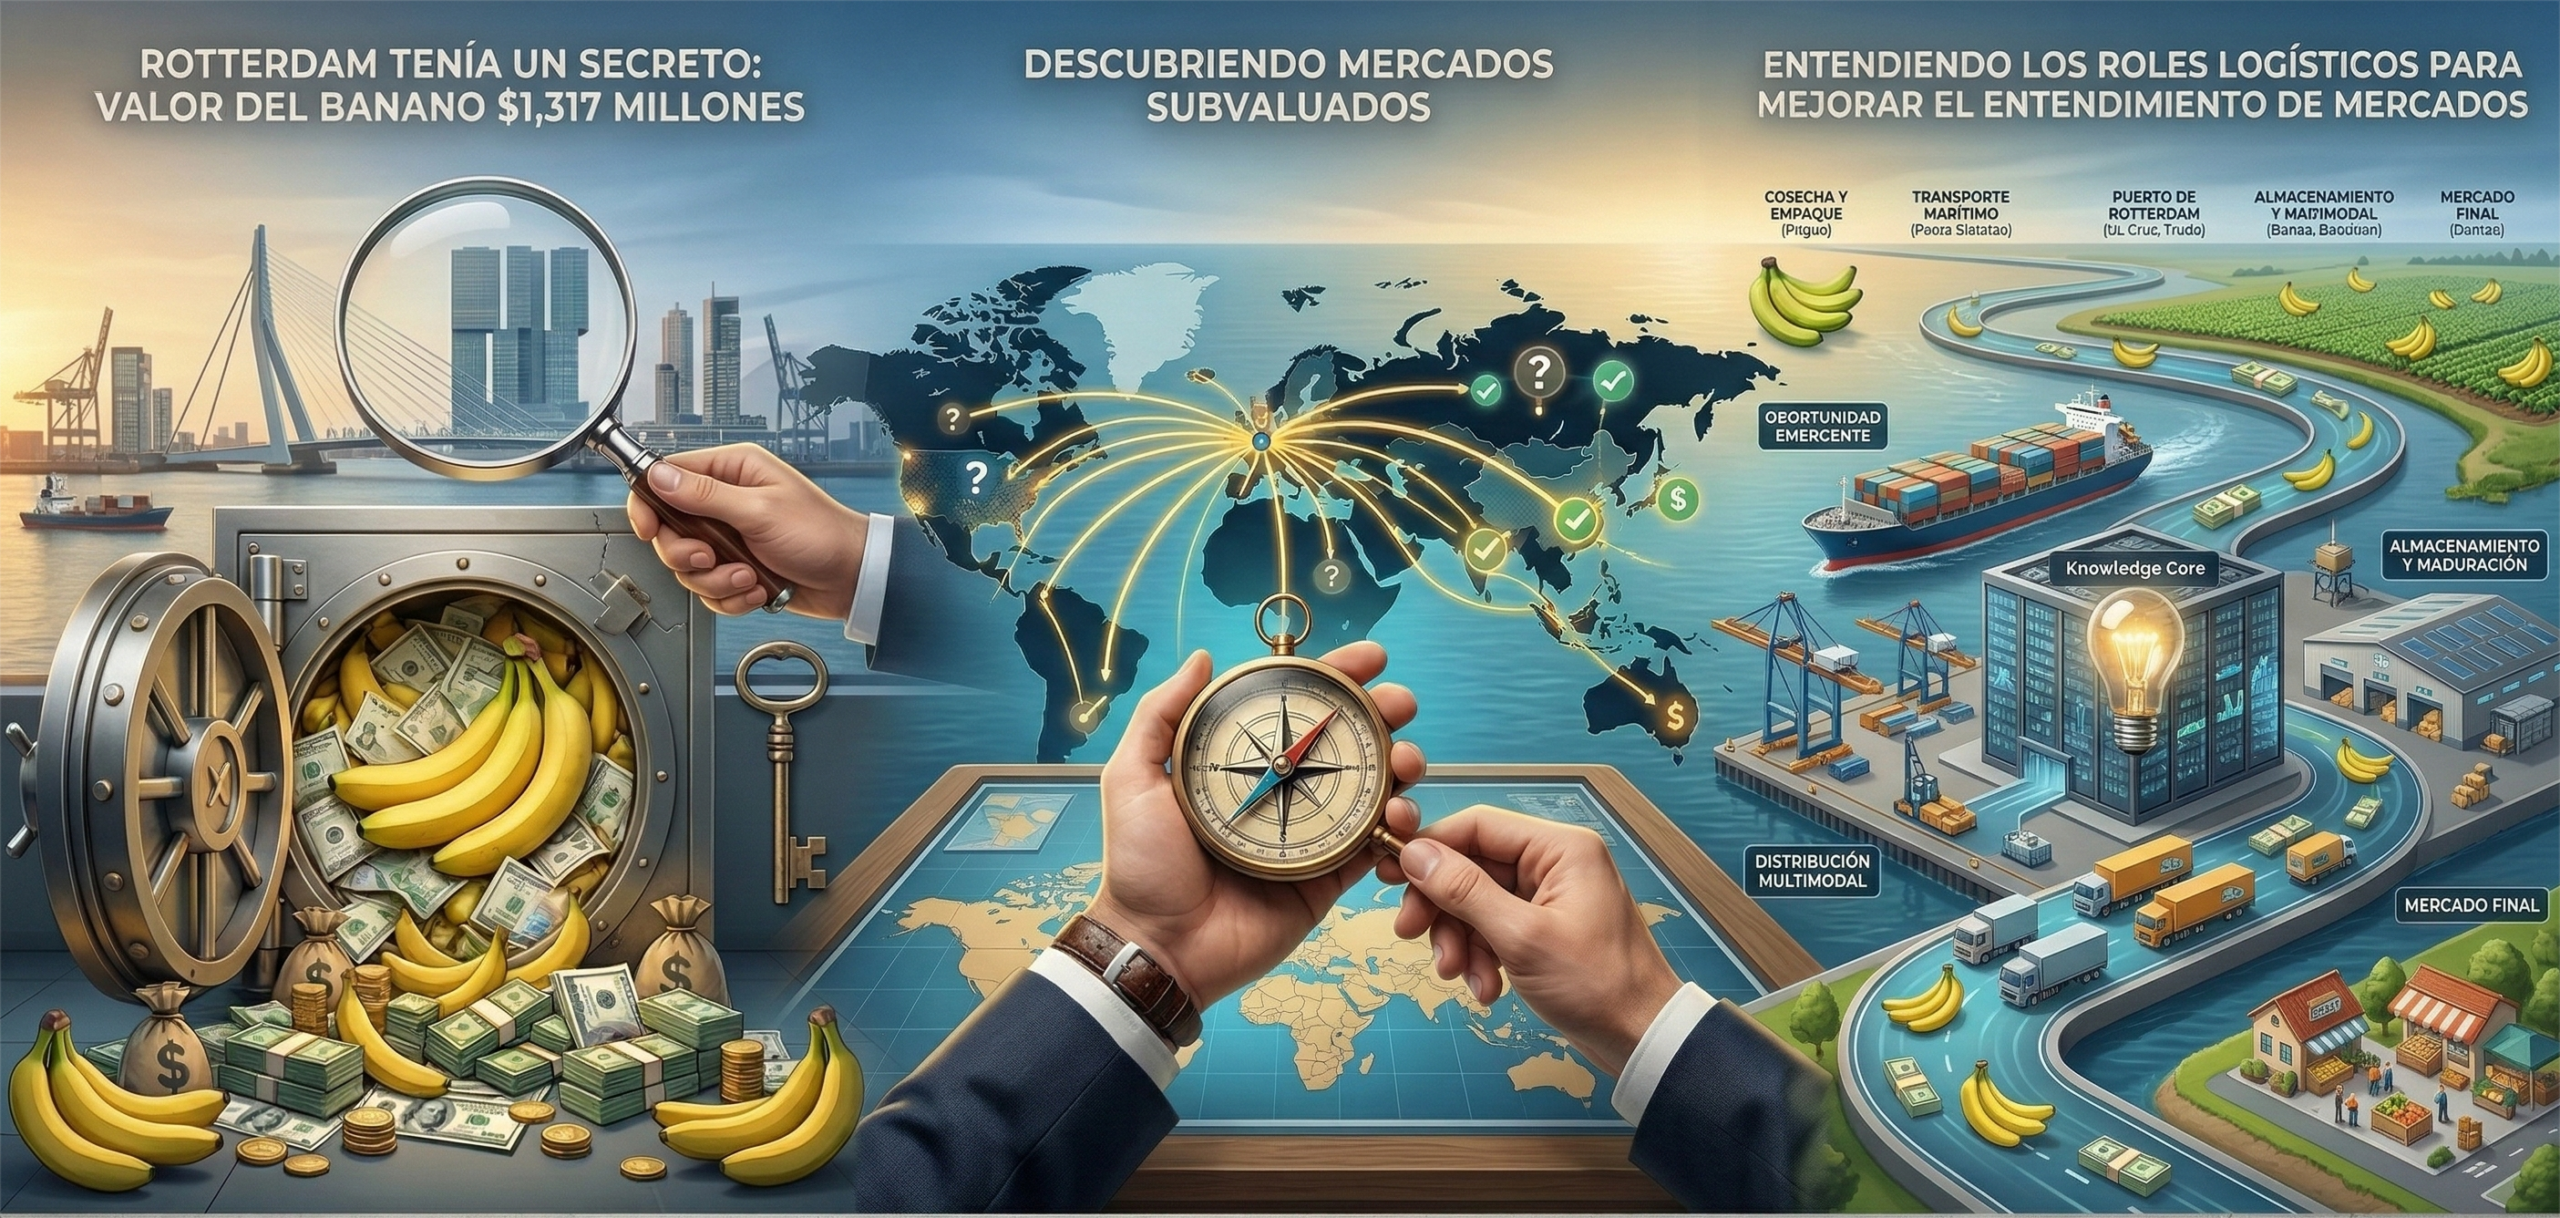
Over eight years, Rotterdam redistributed $1.317 billion of Latin American banana it never recorded as its own import. And the Netherlands bought $691 million additional of banana that arrived via European operators — whose real origin remains invisible in conventional data.
The main protagonists of the redistributed banana are Ecuador with $436 million accumulated and Colombia with $313 million. The main European channels are Germany ($190M) and Belgium ($169M).
What This Means for Any Exporter
If your data says you sell to the Netherlands, Belgium, or Germany — you are probably not selling to those countries. You are entering through them. Your real market is further down the chain, and today you cannot see it in your export reports.
That matters for three concrete decisions:
To understand your real market. Does your product end up in German retail, Polish wholesale, Scandinavian distribution? Today that answer does not exist in your data. But the difference between BACI and TradeMap gives you a first approximation of the size of each flow.
To evaluate routes. Does it make sense to go direct Ecuador-Germany or is using the Dutch hub more efficient? That question can only be answered if you first know how much of your current volume is already reaching Germany via Rotterdam — and what that intermediate step is costing you.
To read prices correctly. CIF prices in Rotterdam mix demand signals from all of northern Europe. If you don’t separate what gets redistributed from what stays, you are making decisions on a blended signal.
An Approximation, Not a Certainty
This method does not reveal everything. It tells us how much is redistributed and how much enters via European operators — but not the final destination of each container nor the exact origin of the banana passing through Germany or Belgium. For that, other sources are needed.
What it does give us is something that did not exist before: a quantified estimate of the hub effect, built on real data, replicable for any product and any trade route.
Rotterdam’s secret was never that it existed. It was that we had never been able to measure it.
Methodological Note
The model compares BACI-CEPII (FOB, exporter declaration) with TradeMap-ITC (CIF, importer declaration) across 409 country-year pairs between 2017 and 2024, HS 0803 (fresh bananas). The CIF→FOB adjustment applies freight proxies calibrated against the OECD ITIC Database: 9% South America, 7% Central America, 11% Africa, 12% Asia. For European re-exporters, the combined factor of 13.96% is applied, discounting intra-EU freight, logistics operator margin, and origin maritime freight. The Excel model with complete 2017–2024 data and linked formulas is available on request.
Want to apply this method to another product or trade route?
📧 [email protected]
🌐 www.formato4.com